Case Study

Predicting Childhood Lead Exposure at the Census Tract Level

Connect with an expert opens in a new page

Challenge

Although lead exposure among U.S. children is declining, significant exposure and subsequent effects remain and harm children disproportionately in certain communities. The National Health and Nutrition Examination Survey (NHANES) estimates childhood lead exposure at a national level, but the data is insufficient for local programmatic decision-making. Identifying disproportionately affected communities remains difficult. State or local blood-lead surveillance data is not universally available; for example, seventeen states do not maintain blood-lead level (BLL) surveillance systems necessary to provide data to the Centers for Disease Control and Prevention. Thus, many U.S. communities have no BLL monitoring results, hindering efforts to reduce lead’s impact.

The Solution

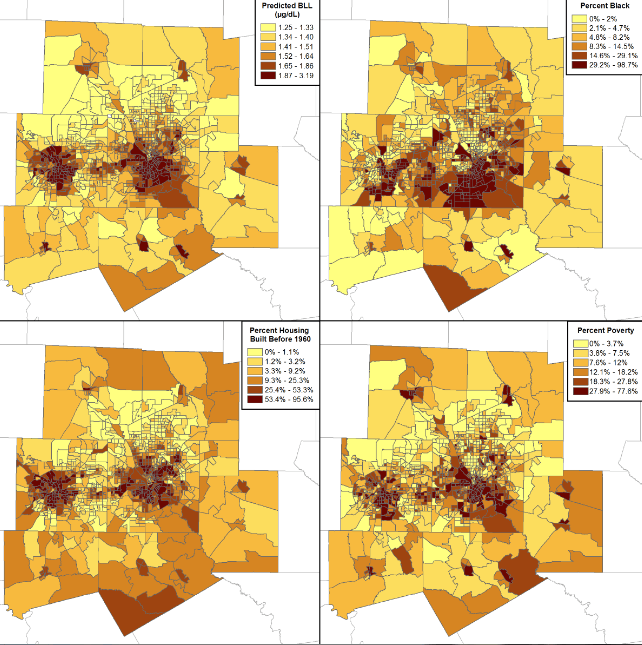
To help identify demographic predictors, we reviewed the literature to identify modeling results which relate childhood lead exposure, as measured by BLL, to predictive factors available at different spatial scales. The demographic predictor data was obtained from the U.S. Census Bureau based on information collected in the American Community Survey. For modeling purposes, we obtained surveillance data from the State of Michigan, Commonwealth of Massachusetts and State of Texas, collected as part of their public health programs. We merged the blood-lead data by census tract with the demographic predictor data. In addition to the predictors available at the census tract level, we also included the season of the blood-lead sampling, whether a capillary or venous blood sample was drawn, the age of the child and the year of the sample to account for long-term trends.

Photo: Image of a Geographical Area

Need reliable data and solutions regarding Public Health?
Connect with an expert opens in a new page

The Outcome

Combining the fitted regression model with readily available U.S. Census demographic predictor data provides predicted child BLL distributions at the census tract level for children of different ages or for populations at different points in time. These predictions provide a powerful quantitative tool for public health and housing officials and other stakeholders in childhood lead poisoning prevention. In particular, these distributions can be used to assess the number of children at risk in different parts of the urban area, which then can be used to help assess various intervention and resource allocation options. For example, the maps in the figure below provide predicted geometric mean BLLs at the census tract level for the Dallas/Ft. Worth area in Texas, along with census tract-level information on race (percentage Black), older housing (percentage built before 1960), and income level (percentage below the poverty level). By considering the demographic maps along with the BLL map, potential correlations can be considered at a useful level of geographic specificity when planning public health interventions or other types of actions.
Battelle has the expertise to support your public health needs.
Explore Public Health opens in a new page

Case Studies

Technology Commercialization and Licensing


With over 90 years of research and development experience, Battelle supports all areas of industry with intellectual property licensing focused on bringing our cross-disciplinary expertise to meet our clients' most difficult challenges.

Explore our ip

Photo: Abstract photo of a lightbulb